Choosing a visualisation type
Goals and audience
The process of deciding what type of data visualisation to create begins with a simple question: Why am I doing this? Data visualisations must serve a purpose so all decisions about chart type, design, layout, and more, should flow from a clear understanding of the intended purpose of a graphic.
Christian Hennig, a statistics professor at the University of Bologna, suggests working through the following questions:
- Is the aim of the graph to find something out (“analysis graph”), or to make a point to others?
- What do you want to find out?
- Who is the audience for the graph? (It may be yourself.)
Identifying the target audience at an early stage is crucial, as different groups of people are likely to have different levels of graph literacy depending on their education level, technical expertise, prior exposure to data visualisation formats, and other factors. Design decisions that do not properly account for the needs of the intended audience will fail to achieve their aims.
Checklist
Before any design decisions are made:
- Be clear about the intended purpose of a data visualisation.
- Understand your target audience, including their needs and familiarity with different visualisation types.
Data
Software tools generally allow users the flexibility to visualise data in whatever format they choose. However, decisions about chart type must be informed either by the kind of data at hand or the data relationship that is of interest. Format choice must then be further guided by audience needs, as previously discussed.
There are a range of online tools to help decide on a visualisation type. We recommend the following:
Type
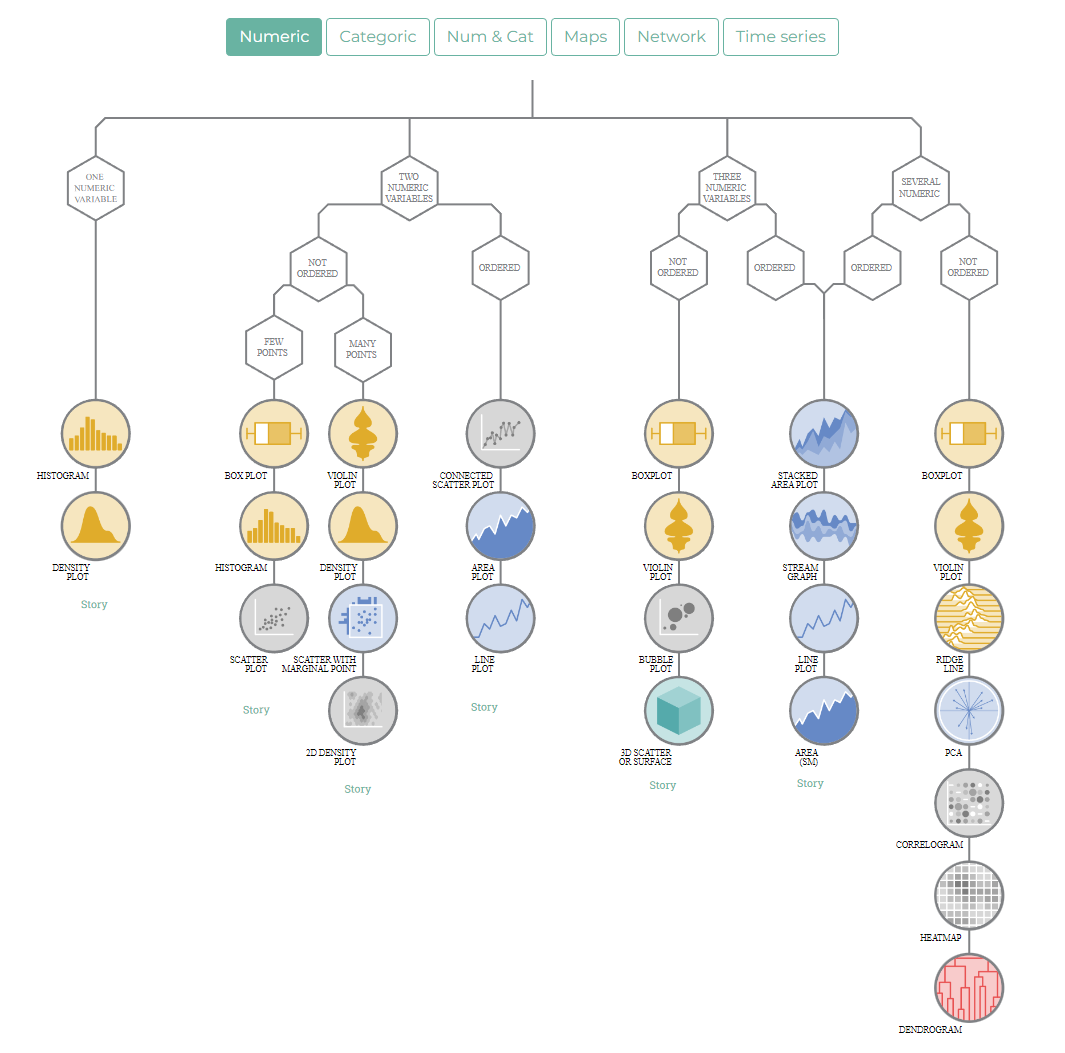
From Data to Viz presents users with a series of decision trees, each leading to different recommended chart formats depending on the type of data selected (numeric, categoric, etc.).
Relationship
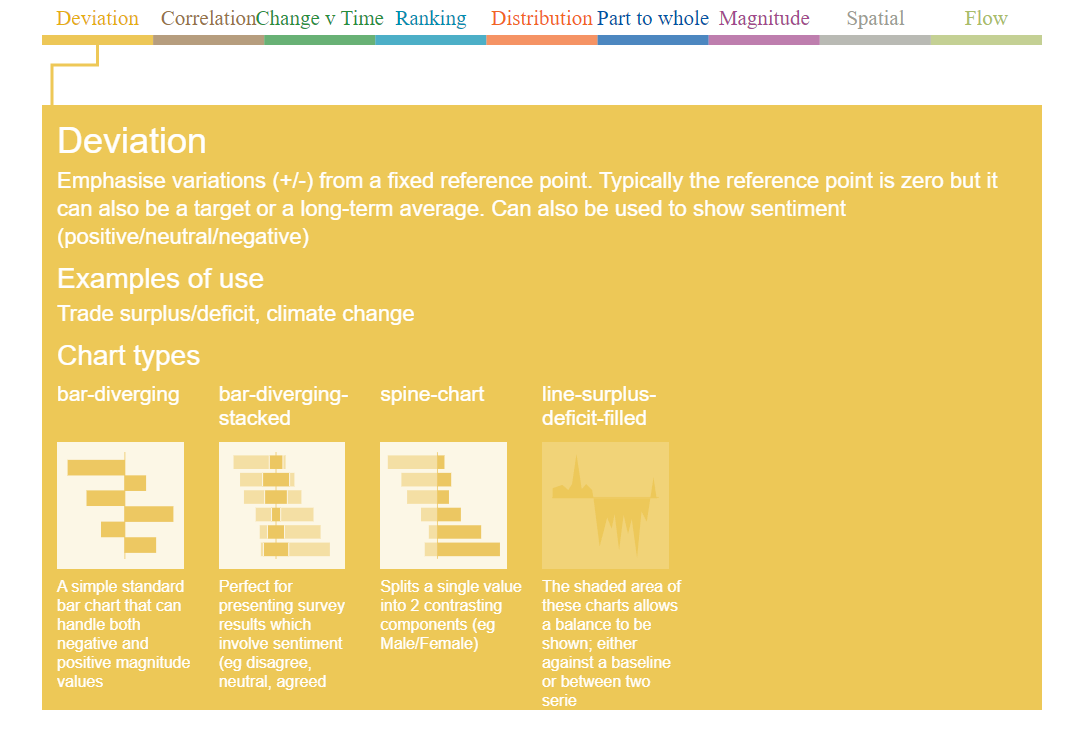
Visual Vocabulary is a site developed by the data visualisation team at the Financial Times. It allows users to narrow down the choice of chart type based on the data relationship that is “most important in your story”. Relationship options include deviation, correlation, change versus time, ranking, and more.
Checklist
- Choose a chart type based on either data type or data relationship.
- When selecting from a range of suitable chart types, keep in mind the needs of the target audience and their likely levels of graph literacy.
Further general guidance is provided by Few’s Show Me the Numbers (Few 2004) and Robbins’ Creating Better Graphs (Robbins 2006).